Network Monitoring And Management

The Top 10 Network Management Solutions

Network management solutions oversee and optimize the performance and security of computer networks by managing devices, monitoring traffic, and ensuring efficient communication.

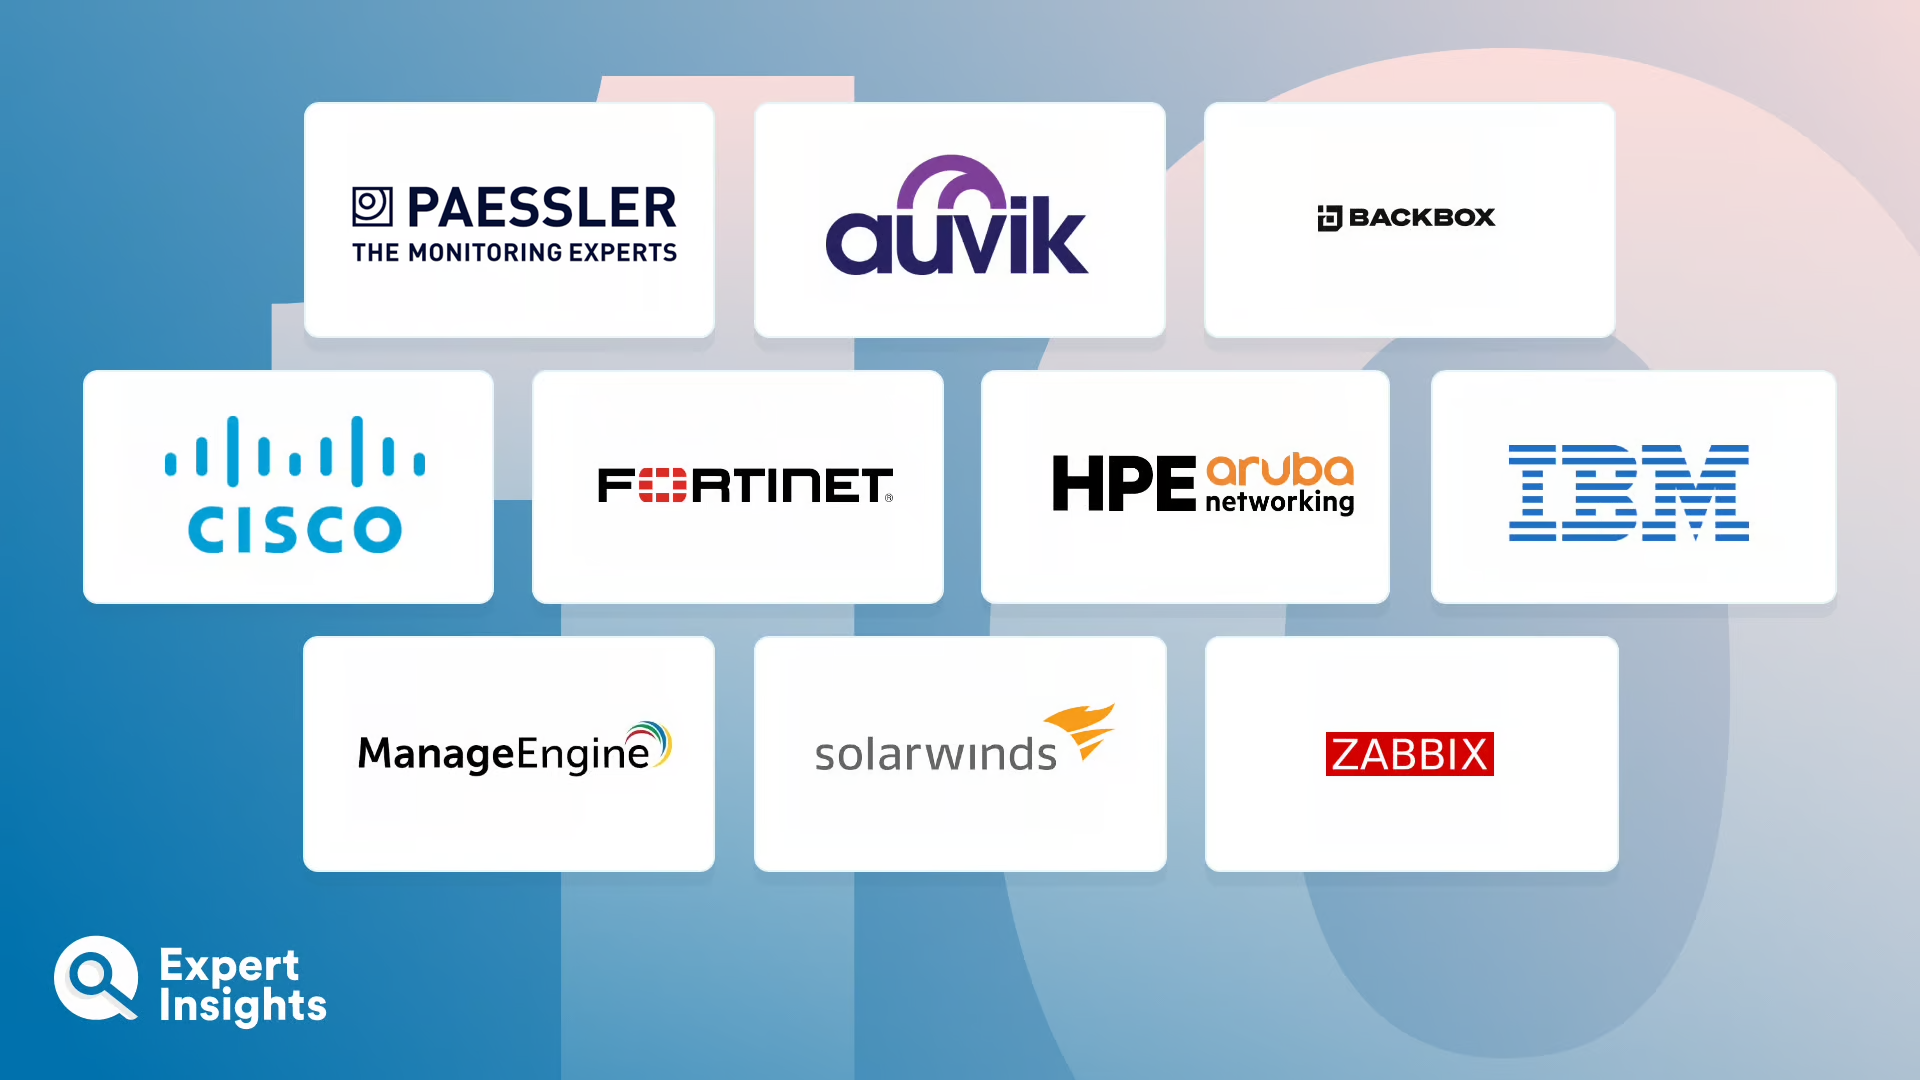
The Top 10 Network Management Solutions include:
  • 1. Auvik Network Monitoring and Management
  • 2. BackBox Network Automation Platform
  • 3. Cisco Catalyst Center
  • 4. Fortinet FortiManager
  • 5. HPE Aruba AirWave
  • 6. IBM SevOne Network Performance Management
  • 7. ManageEngine OpManager
  • 8. Paessler PRTG
  • 9. SolarWinds Network Topology Mapper
  • 10. Zabbix

Network management solutions are essential tools for monitoring, maintaining, and optimizing networks. They help IT administrators ensure the smooth and secure operation of their organizations’ IT infrastructure by identifying potential issues, automating management and maintenance tasks, and aggregating key performance and health data— all of which help IT teams identify and troubleshoot problems, and minimize network downtime. Network management solutions are also sometimes known as network management systems. 

Network management solutions are available as both on-premises and cloud-based platforms, and can cater to both small businesses, large enterprises, and managed service providers (MSPs). They typically consist of various components and features that are designed to address different aspects of network management, such as monitoring network devices, analyzing traffic patterns, and managing security policies. 

In this article, we’ll explore the top network management solutions to monitor, optimize, and secure your network. We’ll highlight the key use cases and features of each solution, including topology mapping, fault detection, performance monitoring, configuration management, real-time alerts, and reporting.

Auvik

Auvik Network Monitoring and Management is a comprehensive solution for businesses seeking to enhance their network visibility, troubleshooting efficiency, and remote management capabilities. With an automated mapping system, Auvik enables users to have complete control and real-time insight into their networks.

One of Auvik’s most notable features is its extensive out-of-box alerting system, which offers over 50 customizable options to notify users of any changes in their networks. This helps admins to anticipate and address potential network issues swiftly, reducing on-site visits and improving overall operational efficiency. Auvik’s interactive topology map allows users to seamlessly navigate through multiple sites or inspect specific devices in depth. Additionally, the platform’s intelligent network traffic analysis helps identify network activity and usage patterns, while its robust automation capabilities help to streamline essential tasks such as documentation and configuration backups.

Auvik’s cloud-based deployment and integrations allows for rapid adoption and compatibility with diverse networks. Auvik offers APIs for powerful workflow creation and integration with third-party applications, granting users access to vital data such as alerts, inventory, and historical statistics.

Auvik
BackBox Logo

BackBox is a network automation platform designed to simplify and automate network configuration management and operations tasks for devices from over 180 vendors. It is trusted by network engineers and is utilized on more than 100,000 networks worldwide.

Key features of BackBox include point-and-click automation solutions for device backup, instant restore, OS updates and patching, compliance audits and remediation, network vulnerability management, and network configuration changes. The platform provides a library of over 3,000 pre-built automations and a script-free way to build new automations. BackBox is highly scalable, designed to work with both large enterprises and service provider networks.

The BackBox platform supports a diverse range of deployment options, including on-premises, cloud-based, or as a service. It features a RESTful API-first approach built on the OpenAPI platform, catering to enterprise needs. For MSPs, BackBox offers vendor-agnostic, single-pane-of-glass views, secure multi-tenancy, rapid onboarding and discovery, and improved network security.

BackBox Logo
Cisco Logo

Cisco Catalyst Center (formerly DNA Center) is a comprehensive network management platform that offers a wide range of features to streamline and enhance IT teams’ visibility into their organizations’ networks. The platform provides a clear overview of the overall health of network devices, clients, and applications, with customizable metrics and suggested remediation for any issues.

Cisco Catalyst Center offers enhanced visibility into endpoints and traffic patterns, as well as granular multilevel segmentation for improved security and flexibility. The platform uses Cisco’s AI Network Analytics’ artificial intelligence and machine learning capabilities to improve network performance and issue resolution by accurately identifying trends, anomalies, and root causes. This advanced analytics minimizes noise and false positives, allowing network administrators to work more efficiently.

The platform offers integrations with solutions like ServiceNow, Apple iOS, Samsung, Intel devices, and Cisco Umbrella, to provide seamless management across multiple platforms and offer direct communication with networks devices for more efficient troubleshooting. With Cisco Catalyst Center’s wide range of features and integration capabilities, businesses can achieve a more efficient and effective approach to network management.

Cisco Logo
fortinet logo

Fortinet FortiManager is a network management solution designed to provide consistent protection across complex hybrid environments. Its key features include accelerated zero-touch provisioning through best-practice templates, as well as streamlined workflows between the Fortinet Security Fabric and over 500 ecosystem partners.

FortiManager offers a “single pane of glass” management console that delivers network insights covering connectivity, resource utilization, device settings, policy status, and alerts. It effectively orchestrates various FortiOS-based networking devices, such as FortiGate, FortiSwitch, FortiAP, and FortiExtender, ensuring consistent enforcement of unified security policies throughout an organization’s network. FortiManager supports up to 100,000 Fortinet devices, including FortiGates, FortiSwitches, FortiAPs, SD-WAN, and FortiSASE.

FortiManager simplifies provisioning, reducing time-to-deployment for branch offices and campuses, and provides enterprise-grade high availability with automatic database backups for disaster recovery. Security automation is achieved via REST API, scripts, connectors, and automation stitches, and the platform is designed with enterprise-ready integrations for partner products such as Splunk, IBM QRadar, ServiceNow, and Tufin,. Finally, administrative domains (ADOMs) enable separation of customer data and efficient management of domains for compliance and operational efficiency, making the platform suitable for MSPs as well as enterprises.

fortinet logo
HPE Aruba

HPE Aruba AirWave is a network management system designed for wired, wireless, and remote connectivity. It supports features such as zero-touch provisioning, client visibility, traffic analysis, reporting, and multivendor integration.

Aruba AirWave simplifies device configuration with configuration groups, assigned templates, and step-by-step workflows. It also supports zero-touch provisioning for automatic deployment. The system provides real-time visibility and control through health and analytics dashboards, including network health, traffic analysis, and unified communications and collaboration (UCC) analytics. Additionally, Aruba Airwave offers role-based access, discovery, topology mapping, stage-based connectivity health, VisualRF for Wi-Fi visibility and management, RAPIDS for intrusion detection, and firmware upgrade and compliance features.

Aruba AirWave is compatible with both Aruba and third-party network devices and can be deployed as a hardware or virtual machine image.

HPE Aruba
IBM Logo

IBM SevOne Network Performance Management (NPM) is designed to provide network observability for NetOps teams to identify and address network performance issues in hybrid environments. It aims to boost network performance and improve user application experiences by proactively monitoring multi-vendor networks across enterprise, communication, and managed service provider settings.

Key features of IBM SevOne NPM include automated network observability, next-gen infrastructure monitoring, flow analysis for improved troubleshooting, ITOps and AIOps integration, dynamic capacity planning, simple troubleshooting workflows, and comprehensive data collection from multi-vendor, physical, virtual, and software-defined infrastructure. The solution offers advanced analytics with machine learning, intelligent alerts for proactive incident management, enhanced visualization tools, and scalability to monitor networks of any size without dropping data.

IBM SevOne NPM improves network performance and user experiences while enabling greater productivity and efficiency across IT teams. With its robust feature set and integration capabilities, this solution supports businesses as they scale and adapts to evolving networking and connectivity requirements.

IBM Logo
ManageEngine logo

ManageEngine OpManager is a comprehensive network monitoring software offering in-depth visibility into the performance of network devices, including routers, switches, firewalls, servers, VMs, and storage devices. With this easy-to-use and affordable solution, businesses can effectively identify and troubleshoot the root cause of issues affecting their networks.

OpManager’s monitors IP-based devices in real-time, ensuring a clear view of device health, availability, and performance. It also monitors both physical and virtual servers and users can access detailed statistics on wireless networks, including access points, routers, switches, and WiFi systems, as well as monitor WAN connections using Cisco IPSLA technology. OpManager also offers storage monitoring features, such as capacity utilization monitors and storage growth trend graphs.

The OpManager platform supports businesses with distributed networks by providing network visibility across multiple locations with probe-specific controls. Network visualization is enhanced through Layer2 Maps, virtual topology maps, Business Views, and 3D floor and rack views for data centers. Lastly, OpManager streamlines fault management by presenting meaningful, color-coded, and severity-based alarms to operators for efficient and effective issue resolution.

ManageEngine logo
Paessler Logo

Paessler PRTG is a network management software that monitors, maintains, and provisions computer networks. It enables teams to track network bandwidth, availability, performance, and hardware through various monitoring functionalities. These capabilities include bandwidth monitoring to see network traffic sources, availability monitoring to ensure devices can be reached, and performance and load monitoring to check network speed, CPU usage, RAM load, and other critical system parameters.

Paessler PRTG detects system failures and router slowdowns, automatically notifying the administrator about the status of these devices. It also monitors server and website availability, sending error alerts through email, network broadcasts, text logs, or SMS. The platform also tracks systems’ up and downtimes, enabling swift detection of faults or slowdowns.

To assure optimal network and server performance, Paessler PRTG provides usage and bandwidth monitoring based on multiple parameters such as IP addresses, port numbers, and protocols. This monitoring can be performed using SNMP, Packet Sniffing, or NetFlow (for specific Cisco devices). The software also allows administrators to view actual bandwidth usage and record monitoring data, enabling the creation of an activity diagram that displays all network usage parameters.

Paessler PRTG offers extensive performance and fault management for networks and servers. It monitors networks for technical problems caused by overloaded servers, crashed connections, or users, helping to control network usage, server capacity, and availability.

Paessler Logo
SolarWinds Logo

SolarWinds Network Topology Mapper (NTM) is a network mapping software designed to automatically plot and maintain a record of an organization’s network. The software uses various methods, including ICMP, SNMP, WMI, CDP, VMware, and Microsoft Hyper-V, for device discovery and multi-level network mapping. It provides an integrated OSI Layer 2 and Layer 3 network map with detailed device information, allowing businesses to save time and resources by eliminating repetitive scanning processes.

One of the key features of NTM is its ability to auto-detect changes to network topology, ensuring an up-to-date network map. The platform can create multiple maps and segmentation diagrams from a single scan. Users can efficiently manage network inventory, perform hardware asset tracking, and automate report creation within the software.

To further streamline operations, SolarWinds Network Topology Mapper allows users to export network diagrams to Visio, PDF, and PNG formats. This feature also populates Visio SmartShapes with network discovery data, saving time on documentation.

NTM can also assist companies in meeting compliance requirements for standards such as PCI, SOX, HIPAA, and FIPS 140-2, by maintaining an up-to-date network diagram and offering FIPS 140-2 compliance.

SolarWinds Logo
Zabbix Logo

Zabbix is a comprehensive network monitoring solution designed to provide IT managers with real-time information on network traffic metrics and device performance. It achieves this by utilizing SNMP metrics or by deploying a Zabbix agent, enabling compatibility with a wide range of network devices. Zabbix tracks various network parameters such as incoming and outgoing traffic, bandwidth usage, packet loss, interface error rates, and TCP connections, among other metrics.

A standout feature of Zabbix is its robust alerting system, which allows users to define flexible problem thresholds and receive notifications when issues arise within their network infrastructure. Zabbix can aggregate collected data across various timeframes, allowing IT managers to identify long-term trends and calculate values such as average traffic or error rates. Additionally, Zabbix offers resource discovery features for seamless device onboarding and offboarding, as well as automatic detection of added, removed, or changed resources.

With its advanced data collection and analysis capabilities, Zabbix serves as a valuable tool for maintaining consistent and accurate network performance data, improving efficiencies and providing comprehensive network management functionality.

Zabbix Logo
Top 10 Network Management Solutions