Business Operations

The Top 10 Business Intelligence (BI) Tools

A summary of some of the best business intelligence and analytics solutions on the market.

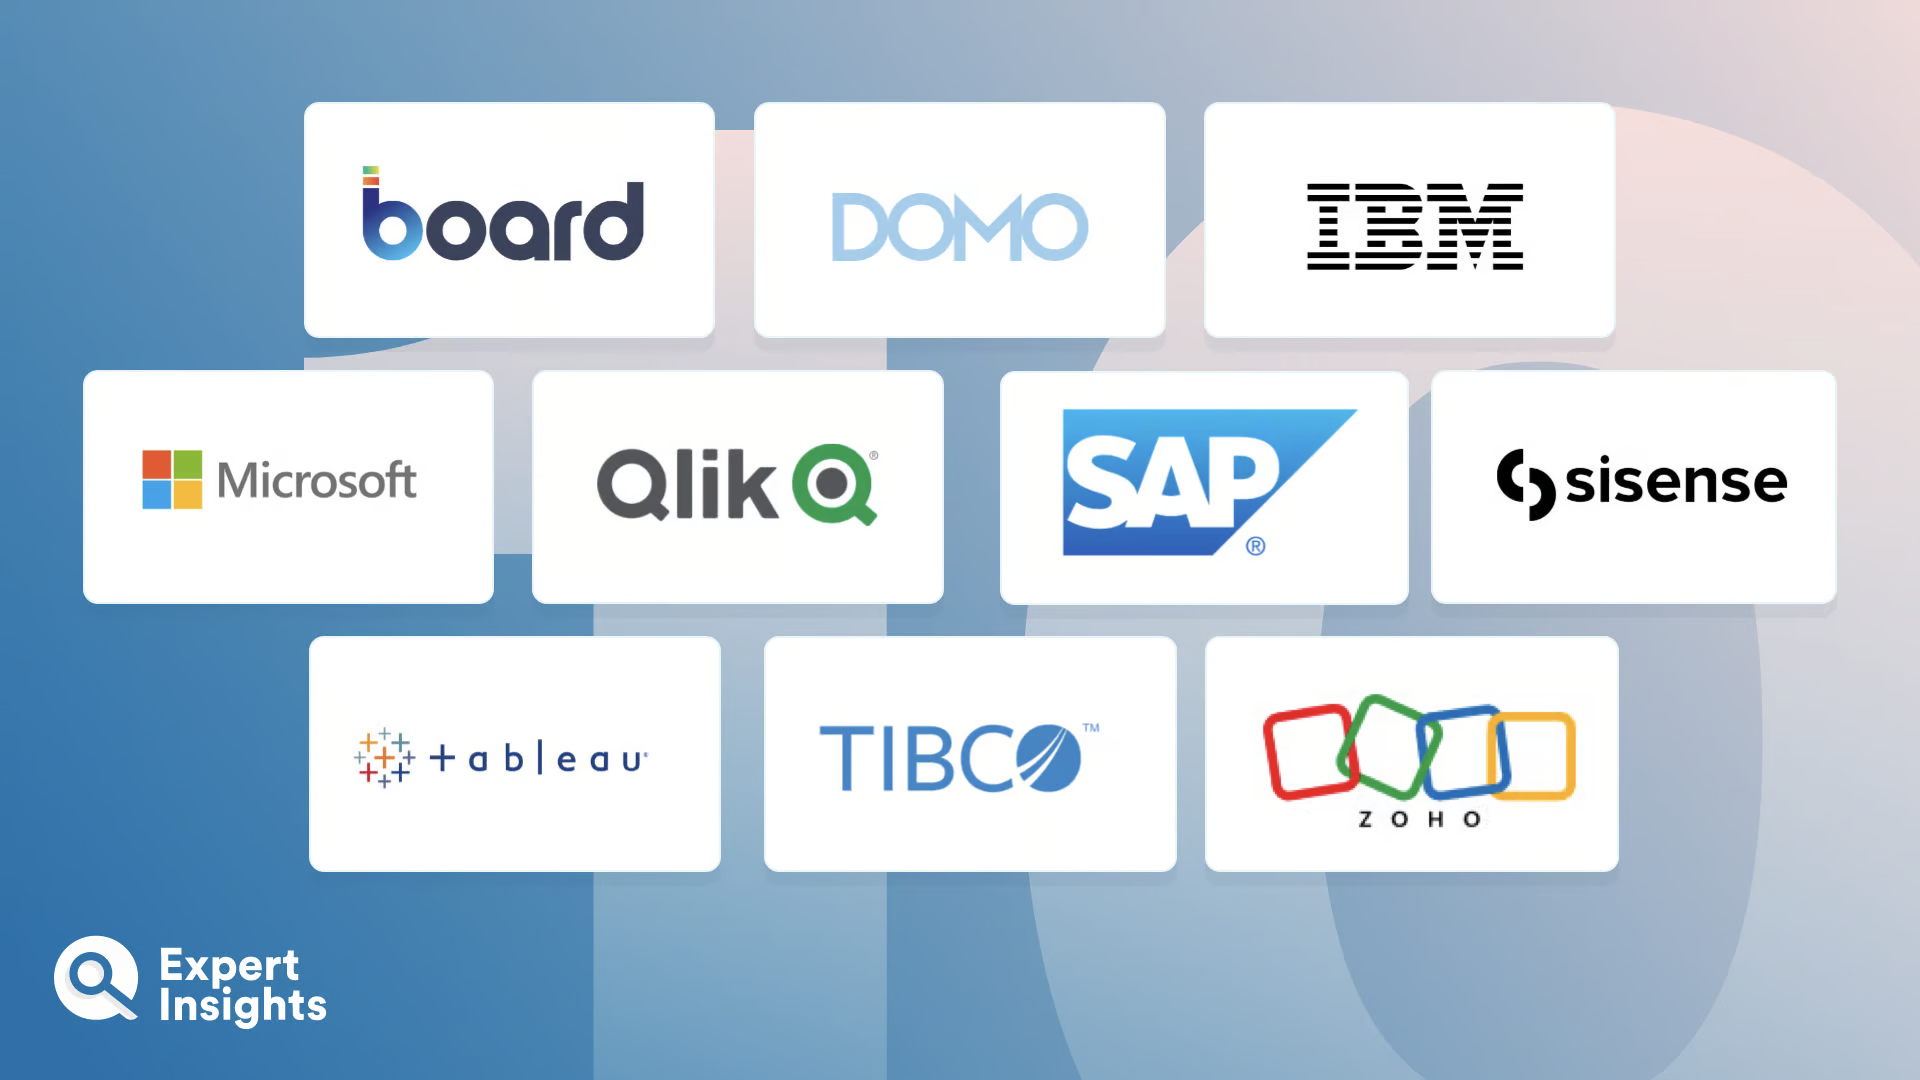
The Top 10 Business Intelligence (BI) Tools Include:
  • 1. Board
  • 2. Domo Data Experience
  • 3. IBM Cognos Analytics
  • 4. Microsoft Power BI
  • 5. Qlik Sense
  • 6. SAP Business Objects BI Suite
  • 7. Sisense
  • 8. Tableau Desktop
  • 9. TIBCO Spotfire
  • 10. Zoho Analytics

Business intelligence (BI) solutions are software tools that unify data and deliver actionable intelligence regarding a particular company or sector. Business intelligence tools are important as they assist companies in developing a targeted and informed business plan that can help instigate change, enter new markets, improve user experiences, and drive sales. 

Business intelligence software should include data analytics, data mining, tools, infrastructure, data visualizations, and other features to achieve this. The more data that a BI tool can ingest, the greater the accuracy of any insights and intelligence gained. This will ensure it can be used to make a compelling case with C-level executives, and that it can be seen as reliable.

Many companies can benefit from implementing a BI solution. As data is collated from both internal and external sources, analysis can help to illustrate where an organization sits in relation to competitors. This data can be visualized in reports which can be shared with relevant team members to aid their strategic planning and act. Business intelligence can also be used to reduce workloads and optimize processes.

In this article, we’ll explore some of the top business intelligence tools on the market today, In each case, we’ll analyze the solution’s specific features so that your organization can find the solution that works for you. We will also offer a suggestion as to which solution is best suited for a particular use case.

Board Logo

Board’s Intelligent Planning Platform is a business intelligence and planning platform that offers powerful analysis, comprehensive dashboards, score carding, and reporting capabilities. It can cross-reference data from relevant datasets, create KPIs, and share reports with relevant users, inside and outside of your network. The platform can collect data from a wide range of sources, including databases, data warehouses, OLAP cubes, flat files, cloud data, CPM, ERP, and IoT devices. Data can be easily manipulated for custom reporting. The solution also offers benchmarking, profitability analysis, and trend indicator capabilities.

One of the platform’s notable features is its predictive analytics capabilities. This means that companies can make targeted decisions based on potential trends and forecasts. The platform offers machine learning forecasting, simulations, clustering, and statistical functions. The solution has a clean, interactive, and intuitive interface, and offers a good level of assistance with onboarding issues. Designed with enterprises in mind, Board have developed a robust, powerful, and technically advanced.

Domo logo

Domo is a software company with a focus on data and analytics. The Domo Data Experience Platform is a fully stacked, cloud-based data intelligence and security solution that provides robust business intelligence. The solution’s other features include data integration, governance, and security. The BI side of the platform offers effective reporting though streamlined dashboards; it is able to combine and correlate data from any source into one place. The solution assists businesses with real-time data for actionable and insightful reports.

The solution’s dashboard is particularly feature rich; admins can customize dashboards to ensure that they are clear and intuitive, as well as doing data storytelling, and collaboration. The platform’s ability to pull data from a wide range of sources is further supported by machine learning, augmented analytics, and artificial intelligence. Embedded analytics allow for the sharing of data and insights outside of your organization. To make management that little bit easier, Domo have developed a mobile application that allows admin to monitor and implement changes on the go. Due to its power, accessibility, and focus on collaboration, we would recommend Domo for medium and large enterprises.

IBM logo

The IBM Cognos Analytics platform is an intelligent and adaptive business intelligence tool that can collect and enhance data, whilst producing insightful and clear data visualizations and advanced predictions. The platform uses AI to understand your business in relation to peers, as well as predicting future trends and opportunities. Each of these insights is backed up by evidence to ensure you have all the facts. The platform utilizes a single open API which enables full access to functionality and the ability to embed business intelligence into other applications.

Despite the solution’s impressive feature set, ease of use and functional reporting is simplified and allows data visualisations to be shared effectively. A mobile app is available so that users can receive alerts and access data on the go. The platform is straightforward to use and has onboarding support from IBM. We would recommend this solution for medium to large organizations who are already integrated with the IBM ecosystem.

Microsoft logo

From industry giant, Microsoft, is the Microsoft Power BI – a highly customizable and intuitive data visualization and business intelligence solution. The platform can access data from hundreds of on-premises and cloud-based sources, including Salesforce, Azure, Excel, and SharePoint. The platform performs automated and incremental refreshes to ensure work and data stays up to date and that data is not lost. Visual data representations are also varied, allowing you to gain different perspectives on your data. The tool’s artificial intelligence capabilities require no code, meaning that users of all experiences are able to access insights for themselves.

Notable features of the solution include a self-service Power Query for data modelling and DAX formula language. Users can use features such as quick measures, grouping, forecasting, and clustering for their data. Reports can be generated quickly (into mobile-friendly formats) for on-the-go users. The platform has a clean and intuitive UI with precise and compelling data visualization tools. The solution is highly accessible, powerful, and intuitive. We would, therefore, recommend Microsoft Power BI for medium and large sized enterprises.

Qlik Logo

Qlik Sense offers two products that can deliver a powerful and cohesive business intelligence solution: Qlik Data Integration and Qlik Analytics. Qlik Data Integration can reliably ingest and manage large amounts of data from hundreds of sources. The platform will then deliver actionable intelligence to a separate analytics solution. It offers data warehouse automation as well as automated ingestion and transformation processes to continuously update and feed data lakes. While Qlik Data Integration can work with any analytics tool, it is best suited to work with Qlik Analytics.

Through its hybrid cloud platform, Qlik Analytics offers a powerful artificial intelligence, unified dashboards, and active analytics capabilities. The solution creates a variety of insightful visualizations which allows users to understand data. The platform itself has a large number of integrations through open APIs. It can also deliver interactive offline analysis and alerts with push notifications. The solution is powerful and comprehensive. We would recommend Qlik Sense’s Qlik Data Integration and Qlik Analytics for medium to large sized organizations with the resources to onboard these solutions.

SAP Logo

The SAP Business Objects BI Suite is a business intelligence and analytics platform that offers intelligence and planning insights. The platform offers real-time business intelligence and self-service access to data and analytics. From here, users can create their own reports. The platform uses ML and AI, data modelling, dashboarding, data visualization, smart data discovery. Other features include predictive analysis and simulation analysis so users can develop an understanding of potential future trends. Organizations can also assess the impact that a strategy change may have on the company. Geo mapping and location analysis allow users to analyze data by region and location trends.

Designed to be as user-friendly as possible, users can create personalized reports and custom analysis. The platform supports offline and mobile capabilities, ensuring users can access intelligence regardless of their immediate situation. The platform itself is streamlined, with one launchpad for all reporting, notifications, apps, and tools. We would recommend the solution for enterprises, due to its scalability, power, and advanced capability.

Sisense Logo

Sisense is a leading cloud business intelligence and data analytics vendor. Their Fusion Analytics solution offers analytics, rich data models, and granular policies that can be branded to match your organization. The solution operates in both cloud or on-premises environments and can be used with a single tenant or multi-tenant architecture. While customization is an option, the platform also provides a range of “out-of-the-box”, industry-specific BI dashboards. It integrates well with your existing environment, quickly connecting to all data–external and internal–for rapid analysis.

The user dashboard is clean, intuitive, and visually appealing. The solution utilizes databases and lakes to create AI-backed data models in granular detail. These findings are then fed into effective and actionable dashboards. The solution can offer valuable business insights across a range of topics including customer segmentation, forecasting, and regression. Users can use statistical and predictive analysis libraries as well as ML to identify new opportunities for growth and development. The platform is robust, whilst maintaining an interactive and engaging UI. We would recommend Sisense Fusion Analytics for large organizations and MSP customers due to its powerful capabilities, in addition to the branding functionality.

Tableau

Tableau Desktop is a data visualization software solution that can aggregate data from your environment to create strong visuals and provide real-time data exploration. The solution integrates well with your existing environment, connecting to on-prem and cloud data sources. It can aggregate data from big data, SQL databases, data lakes, files, and cloud apps. The platform offers augmented analytics, powered by artificial intelligence and machine learning, based on natural language, data prep, and statistics. AI also enables predictive modelling, which allows for scenario planning, predictions, and guided model building.

Tableau Desktop can automatically reduce noise within data, thereby reducing the need for manual work and improving visibility. The platform offers self-service data preparation, mobile exploration, and authoring, as well as advanced analysis. The platform’s dashboards are easy to customize and can be tailored to specific datasets that you use most. The interface also has drag-and-drop buttons for easy creation. Tableau Desktop is easy to use, powerful, and accessible. We would recommend this solution for SMBs to enterprises that need a robust, yet versatile solution.

Tibco logo

TIBCO Spotfire is a data analytics and visualization platform. The solution provides AI-contextualized analytics, custom business applications, data streaming technology, and guided insights. Data can be analyzed while at rest, and in motion, for accurate trend predictions. The solution integrates well with existing environments and IoT devices and supports data integration. Customization capabilities are strong, with the ability to integrate with any visualization library, API, and workflow.

Users get a single-pane view for all visual analytics, insights, and data discovery. Dashboards are clear and engaging to view. The platform also contains a GeoAnalytics feature, allowing users to analyze and create layered maps for deeper insights and automatic context using location-based data. The solution has over 70 native connectors and supports infinite custom connections via APIs, allowing access to a wealth of data. Reports and data can be easily shared between users through immersive dashboards. TIBSCO Spotfire is a comprehensive platform with the ability to leverage insights from anywhere. We would recommend TIBCO Spotfire for medium and large sized businesses.

Zoho Logo

Zoho Analytics is a data analytics and business intelligence platform that operates as a self-service platform that can support users in finding patterns, analysing data, and creating concise data visualizations. The solution can pull data from a range of environments and files, including URL feeds, databases, applications, Microsoft Office, as well as data from the cloud such as Salesforce, Google Drive, and DropBox. Correlated data is then contextualized through integrated mathematical and statistical formulas. The solution is available in both cloud and on-premises deployment options.

Designed to be as user friendly as possible, the solution uses AI to help users navigate the platform, create automated insights, predict trends, perform analysis, and set up alerts. Users can also build reports and dashboards with an easy “drag-and-drop” interface, helping them to highlight the charts, pivot tables, and widgets that matter most to their business. The smart-cleanse feature can filter and reduce noise through intelligent suggestions and prompts. This also allows users to remove duplicated data and invalid entries. Auto modelling allows the platform to automatically identify data types. We would recommend this solution for medium to large sized companies that frequently have to share data outside the network.

The Top 10 Business Intelligence (BI) Tools